· Live On Chart · TradingView
{INDICATOR_CHART_SLIDES.map((s, i) => (
 ))}
))}
{INDICATOR_CHART_SLIDES.map((_, i) => (
One indicator. Seven independent modules. A live confluence dashboard pinned to your chart, a structural pivot classifier, an independent SMA-ribbon signal layer, swing-pivot liquidity levels, ATR chop detection, a session lockout system that silences signals during low-quality windows, an optional tutorial walkthrough with pattern detection, and a context-sensitive chart legend.
GHOST reads historical price data and visualises patterns. It does not predict the future. It does not know your situation. What it does, well, is give you a clear, top-to-bottom read of the market state — so you can decide whether the conditions you trade in are actually present.
Four cells: Push, Score, Status, Signal. Always renders. Tells you at a glance whether the stack is aligned.
ATR-based range detection. Yellow boxes mark no-trade ranges. Combined with No-Trade ✕, signals fired in chop become untradeable automatically.
Swing-pivot liquidity levels. Auto-clusters within ATR tolerance. Auto-deletes when swept. Targets, stop placement, structural bias.
HH / LH / LL / HL classification. Auto-sensitivity by timeframe. Volume circles or Tag style. Confirmed-only or with real-time tentatives.
Hard signal suppression during low-quality session windows. Three Dead Zones (thin tape) and three Sweep Windows (algorithmic liquidity hunts). Inside a window, BUY/SELL/TP/alerts all go silent, candles overlay with a MACD-intensity gradient.
Independent 5-8-13 SMA ribbon layer. Three conditions must align: ribbon alignment, confirmation, ATR proximity. Does not consult the confluence stack.
Optional second dashboard with live, contextual explanations of each stack layer. Plus a context-sensitive chart legend that adapts to your active modules.
13 classifiers running live: Hammer, Shooting Star, Engulfing, Doji, Marubozu, Inside / Outside Bar plus structural patterns — Double Top / Bottom, Head & Shoulders, Triangles, Wedges, Flags. Surfaced as a dedicated row in Tutorial Mode and a floating label on the most recent qualifying bar.
Chop Zones, the No-Trade ✕ filter, and the volume-based Reversal Bubbles aren't separate features — they're a stacked filter chain. When all three align, what's left is the cleanest possible entry: a high-volume reversal at structure, breaking out of range, with no veto on the bar.
Yellow boxes mark ATR-compressed range. Tells you the market is consolidating. Any signal fired inside the box is automatically suspect — price is rotating, not trending.
A gray ✕ stamps any BUY/SELL that fires while the stack disagrees — chop active, score too low, bias mismatched. The trigger renders so you can see it, but it's flagged untradeable at a glance.
Reversal pivots size by relative volume. Big bubbles = real participation at the level. Small bubbles = thin, ignorable. The bubble at the swing is your structural footprint.
Chop ends → ✕ lifts → large volume bubble at the demand pivot → BUY fires clean. Three independent filters all pointing the same way. That's the entry.
The early bars are inside chop, vetoed by ✕. Price grinds sideways. A high-volume bubble prints at the demand pivot — the structural turn. Chop dissolves. The next BUY is clean: no ✕, fresh trigger, ribbon flipping green. That's not luck. That's three filters refusing to fire until the stack agrees.
Asia Dead Zone. NY Lunch. London Lunch. London Open sweep. NY Open sweep. Six windows where retail signal generators chew themselves to pieces. Lockout silences the indicator at the source — no BUY, no SELL, no TP, no alerts — and tints the candles so you can see why.
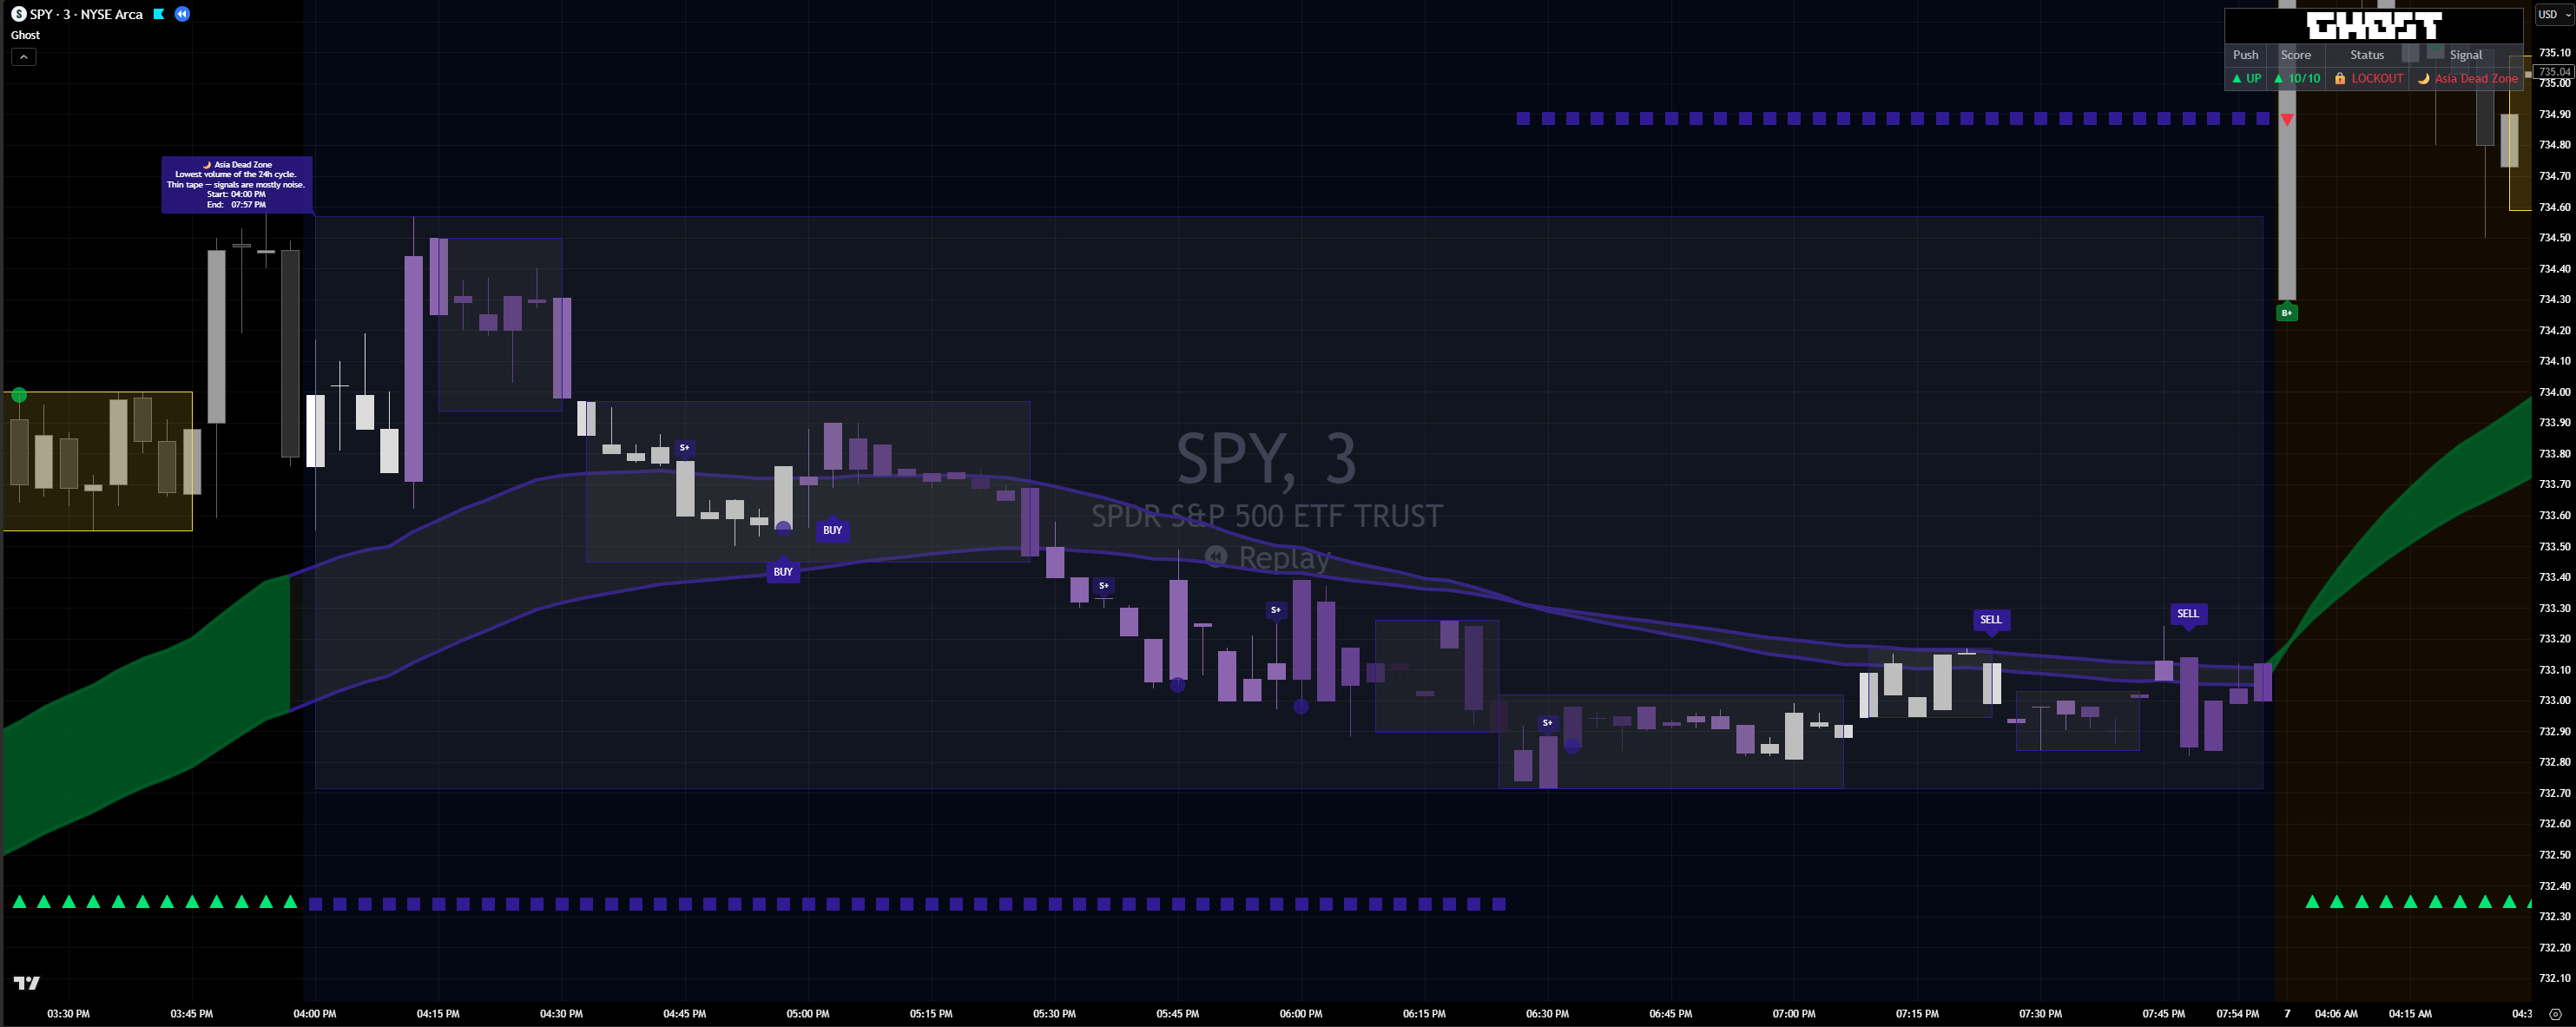
Asia, NY Lunch, London Lunch. Lowest-volume windows of the 24-hour cycle. Thin tape — most signals here are noise.
London Open, London → NY Transition, NY Open. High-velocity liquidity hunts. Algos take both sides before committing direction.
Purple inside Dead Zones, red inside Sweep Windows. MACD-style intensity — darker bars are where the algo is most aggressive.
Inside a window, every signal layer goes silent at its source. No BUY / SELL labels, no TP lines, no alerts firing in your inbox.
Status cell flips to 🔒 LOCKOUT. Signal cell names the active window so you know why the chart went quiet.
Enable Lockout once, then choose which windows you respect. Trade the London Open if you specialize in it. Skip the rest.
The six windows aren't arbitrary clock times. They map to the lowest-quality session segments in real volume and follow-through data — the segments where momentum signals statistically fail.
Discipline isn't a willpower problem when the indicator literally won't show you a setup. The default state is wait — and you have to override it on purpose, not by accident.
Most blown trades happen in the same six windows every day. Lockout removes the temptation to take them — no signal renders, no alert fires, the chart literally tells you to wait. The cleanest edge in trading is the one you skip.
Open the GHOST script page on TradingView. Click Add to favorites or Use on chart directly. The script compiles and loads.
Open the indicator settings (gear icon), find the ⚙ Setup section, check the box marked "I have Read & Accept the Disclaimer." This unlocks all visual modules.
In the 🧩 Modules group, toggle each major feature on or off. Chop Zones and Supply/Demand default ON; Reversal Signals, Ghost Signals, Session Lockout, Tutorial Mode, and Chart Legend default OFF.
GHOST gives you a framework, not a fantasy. No magic buy-now arrows, no “guaranteed” signals — just a clean, top-to-bottom read of the market state so you can call the shot. The disclaimer is there to set the standard before you ever click an arrow: this is a tool that sharpens your edge, not one that thinks for you.
Pick a plan, complete checkout, drop your TradingView username — and Ghost loads on your chart.